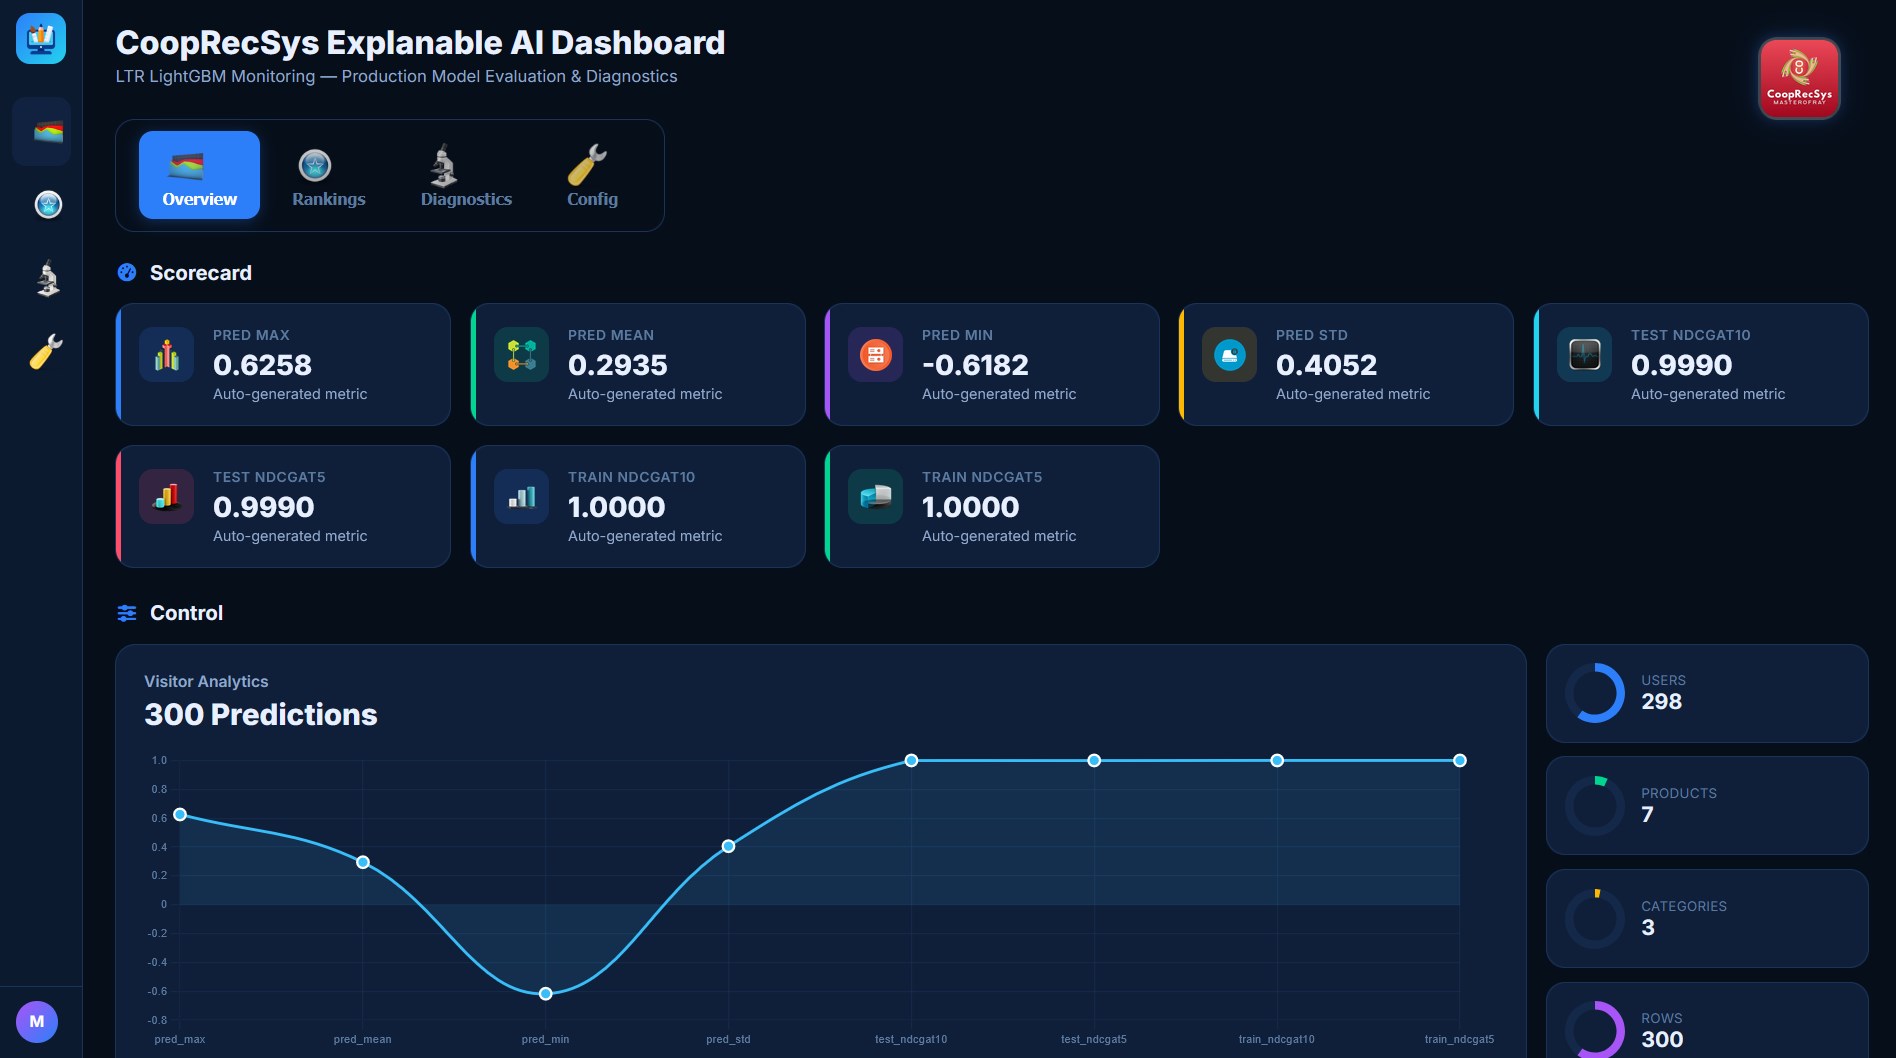
CoopRecSys separates model mathematics from human-facing reporting. report.py, narative/, viztower/, and the shared assets/ utilities turn model outputs into diagnostics and operational artifacts.
Dashboard surfaces
- Overview — prediction, model, and dataset status.
- Rankings — inspect recommendation ordering and score context.
- Diagnostics — inspect score distributions, feature importance, drift, and selected explanation samples.
- Configs — inspect the effective model/runtime configuration.
Ranking surface
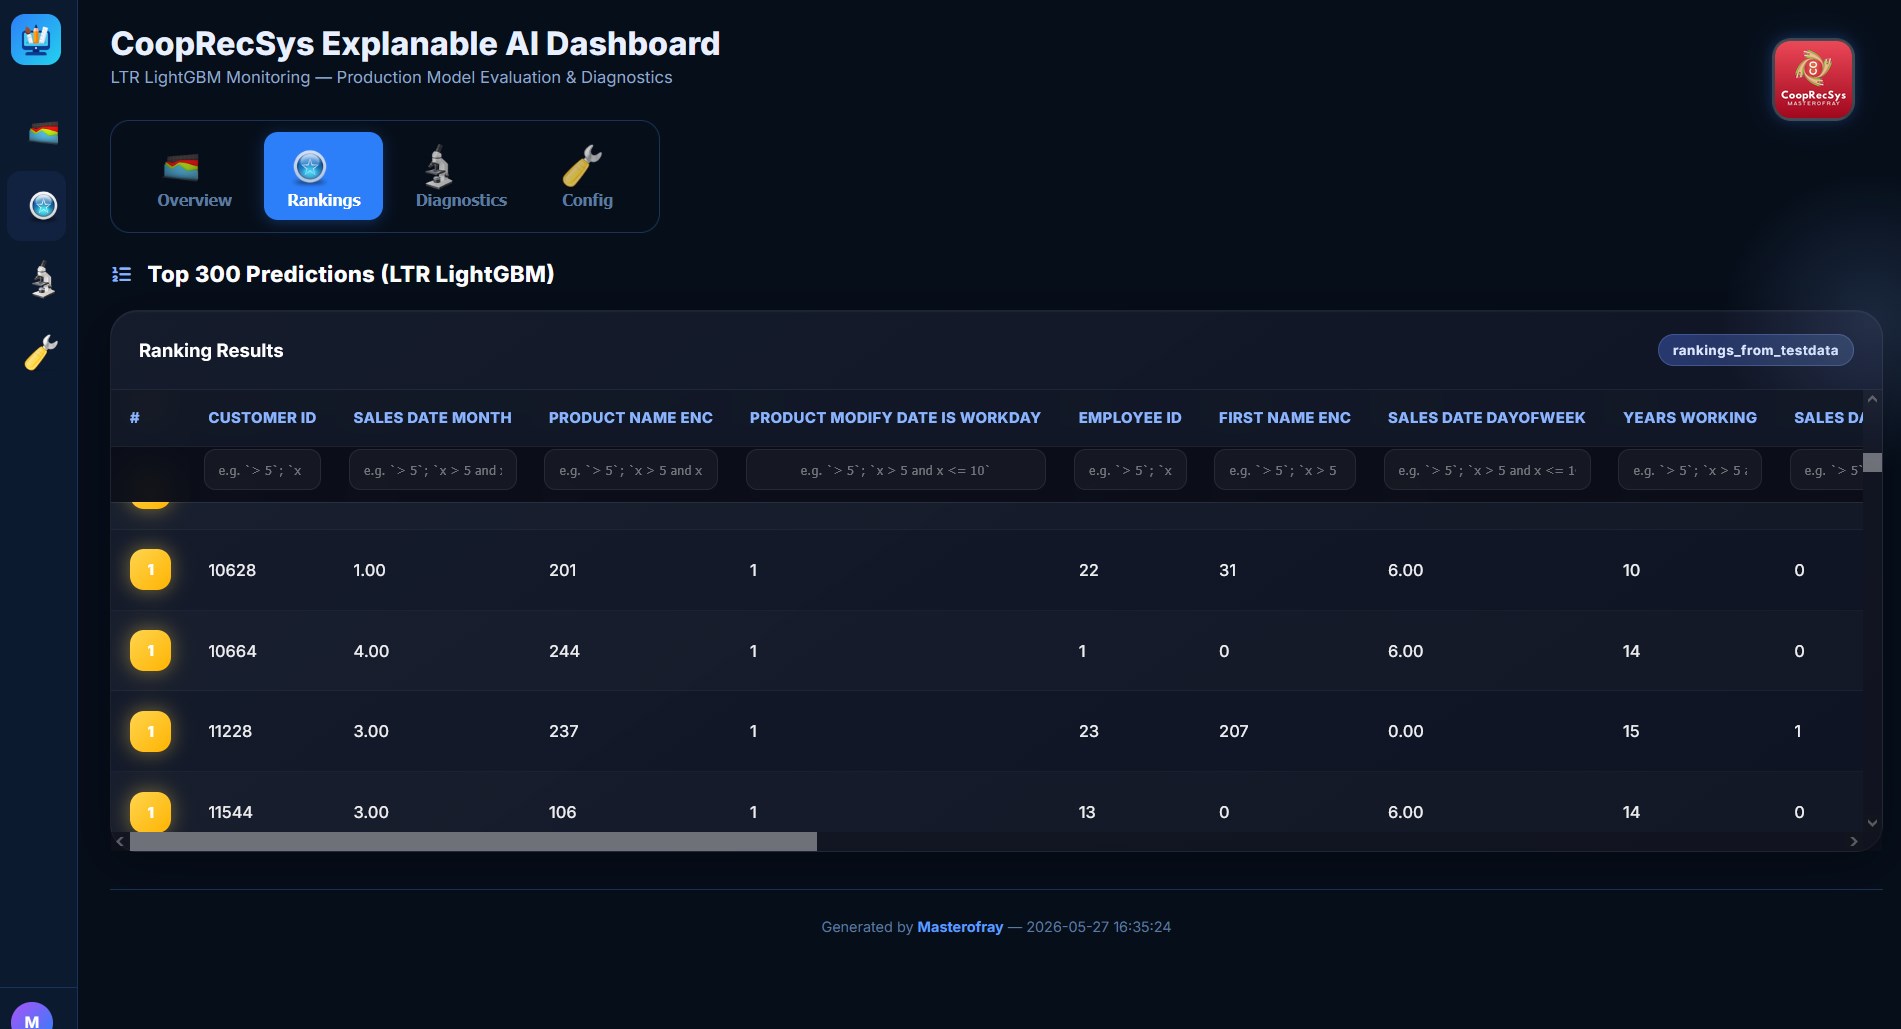
For Ary2Tower, a useful ranking report should expose requested N, returned N, exclusions, fallback count, and source (model_topn vs residual fallback) so a shortfall can be diagnosed rather than hidden.
Diagnostics surface
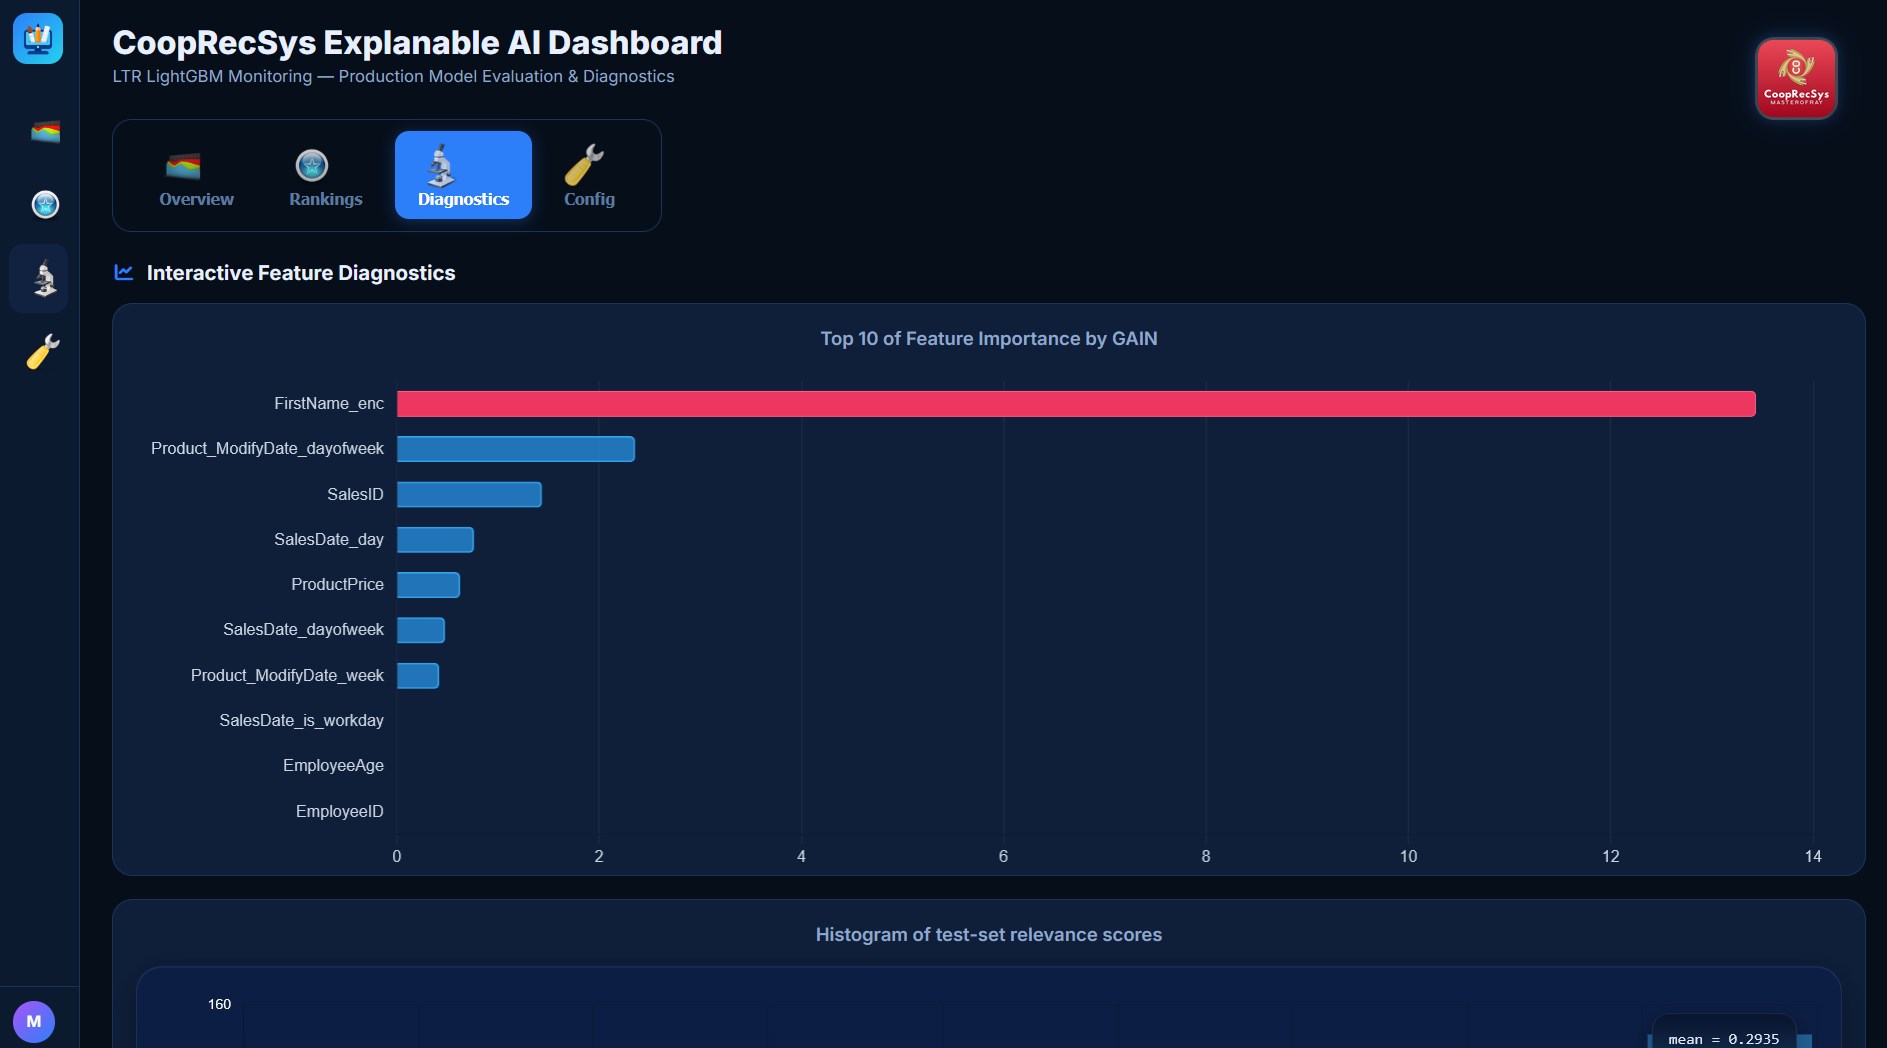
Diagnostics can combine feature importance, score distributions, embedding projections, drift indicators, SHAP samples, and backend/runtime information. Native backend selection is a deployment diagnostic as much as it is a performance setting.
Configuration surface
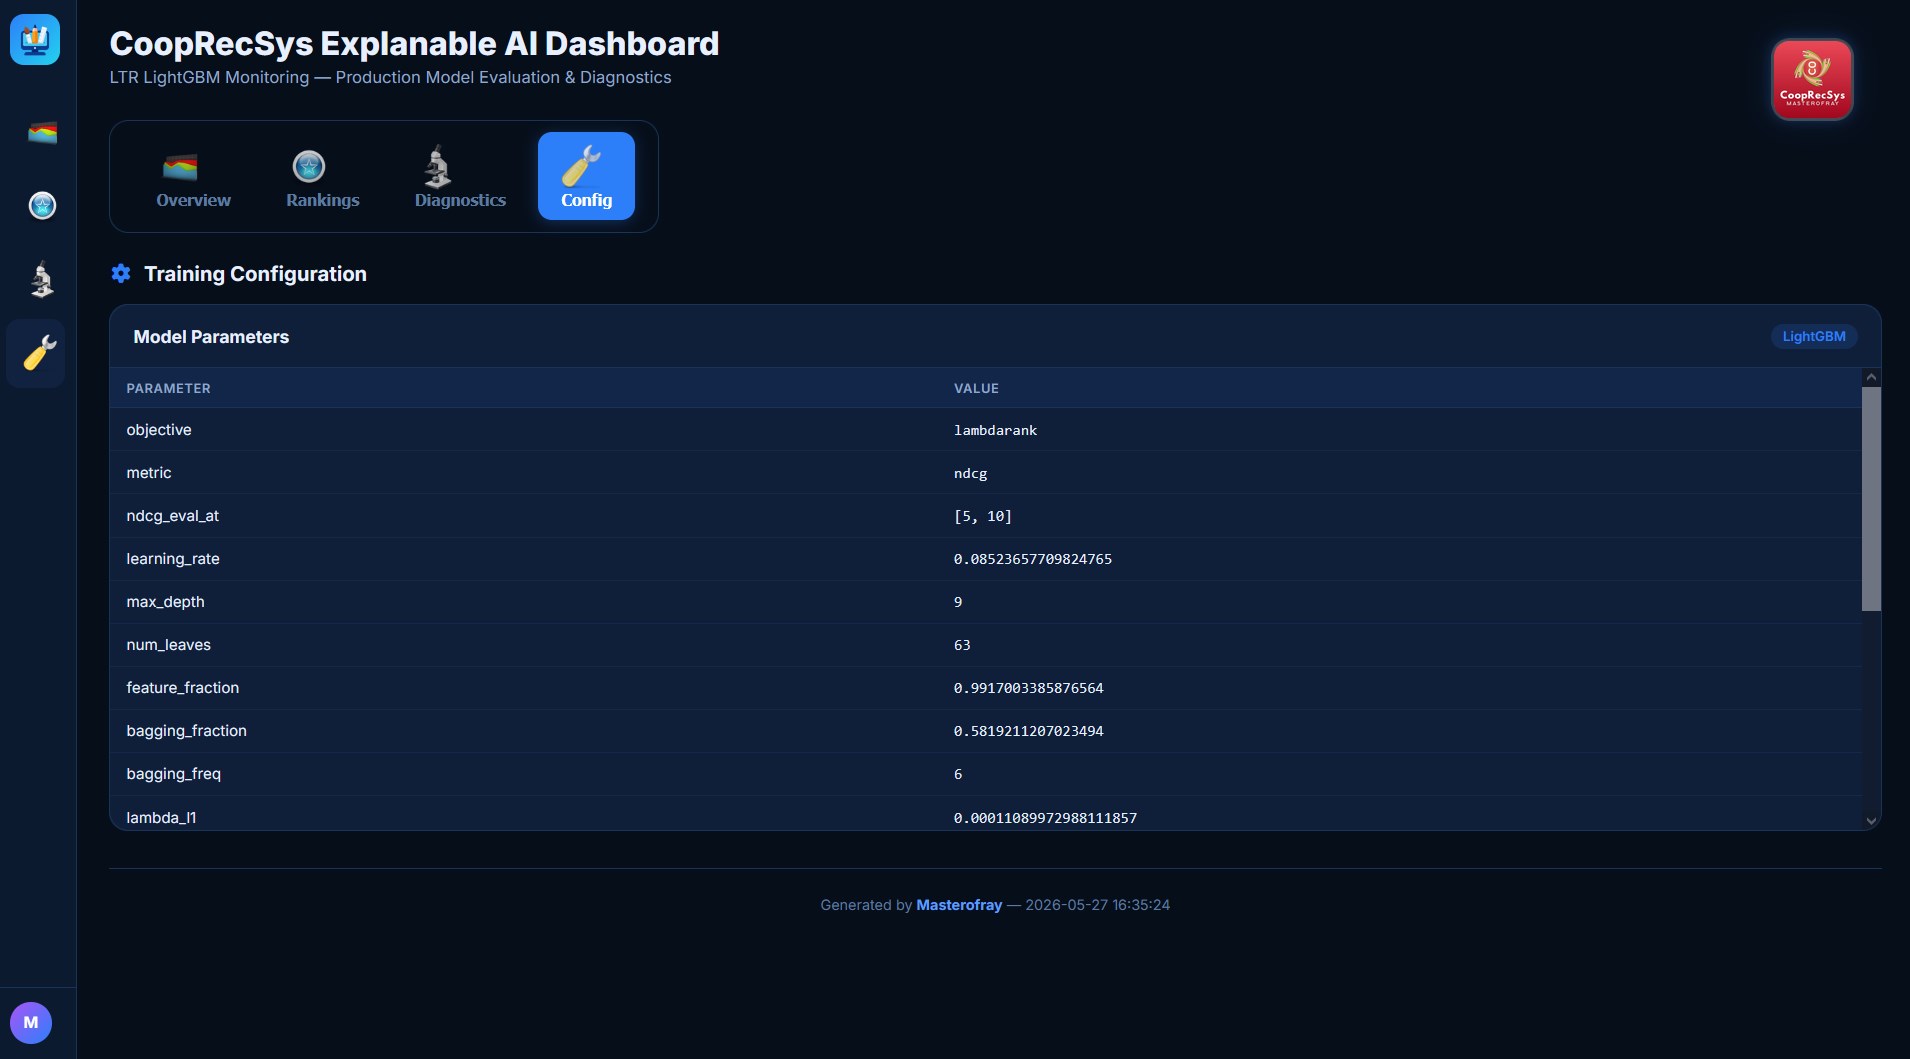
The configuration surface should reflect the actual files under configs/ plus model-local configuration. See Configuration Files for the exact sections and their purposes.
Narrative reporting
Each model may expose a narative/ tree containing report renderers, templates, static CSS/JavaScript, and support code. These components should explain model behavior without changing model weights or ranking logic.
Operational principle
model output
   ↓
ranking + runtime metadata
   ↓
feature / embedding / score diagnostics
   ↓
narrative report
   ↓
analyst / ML engineer review